After facing unexpected latency issues after a release, our team decided to invest some time in setting up a load testing framework for the backend APIs to catch such issues before they went to production. This was particularly important for the feature we built since it tends to receive a sudden influx of users. Accordingly, I setup k6 for our product. I chose k6 because it was the most popular and open-source option, although Artillery seemed cool too.
Setup
The setup was easy enough since we already had a pre-production staging setup with sufficiently large data to mock production. Copilot produced the boilerplate code. For starters, I wrote tests only for the APIs used by the landing page after login. k6 makes it really easy to describe what sort of load you would like to emulate. To get started, I configured like this-
export const options = {
  thresholds: {
    http_req_failed: ['rate<0.01'],
    http_req_duration: ['p(95)<2500'],
  },
  stages: [
    { duration: '30s', target: 5 }, // Ramp up to 5 users over 30 seconds
    { duration: '10s', target: 0 }, // Ramp down to 0 users over 10 seconds
  ],
};
Since these tests would eventually be part of the CI pipeline and run in Github Actions, I thought it would be neat if we could get a summary of the key metrics in Slack. I followed this great blogpost with some tweaks.
xk6-dashboard
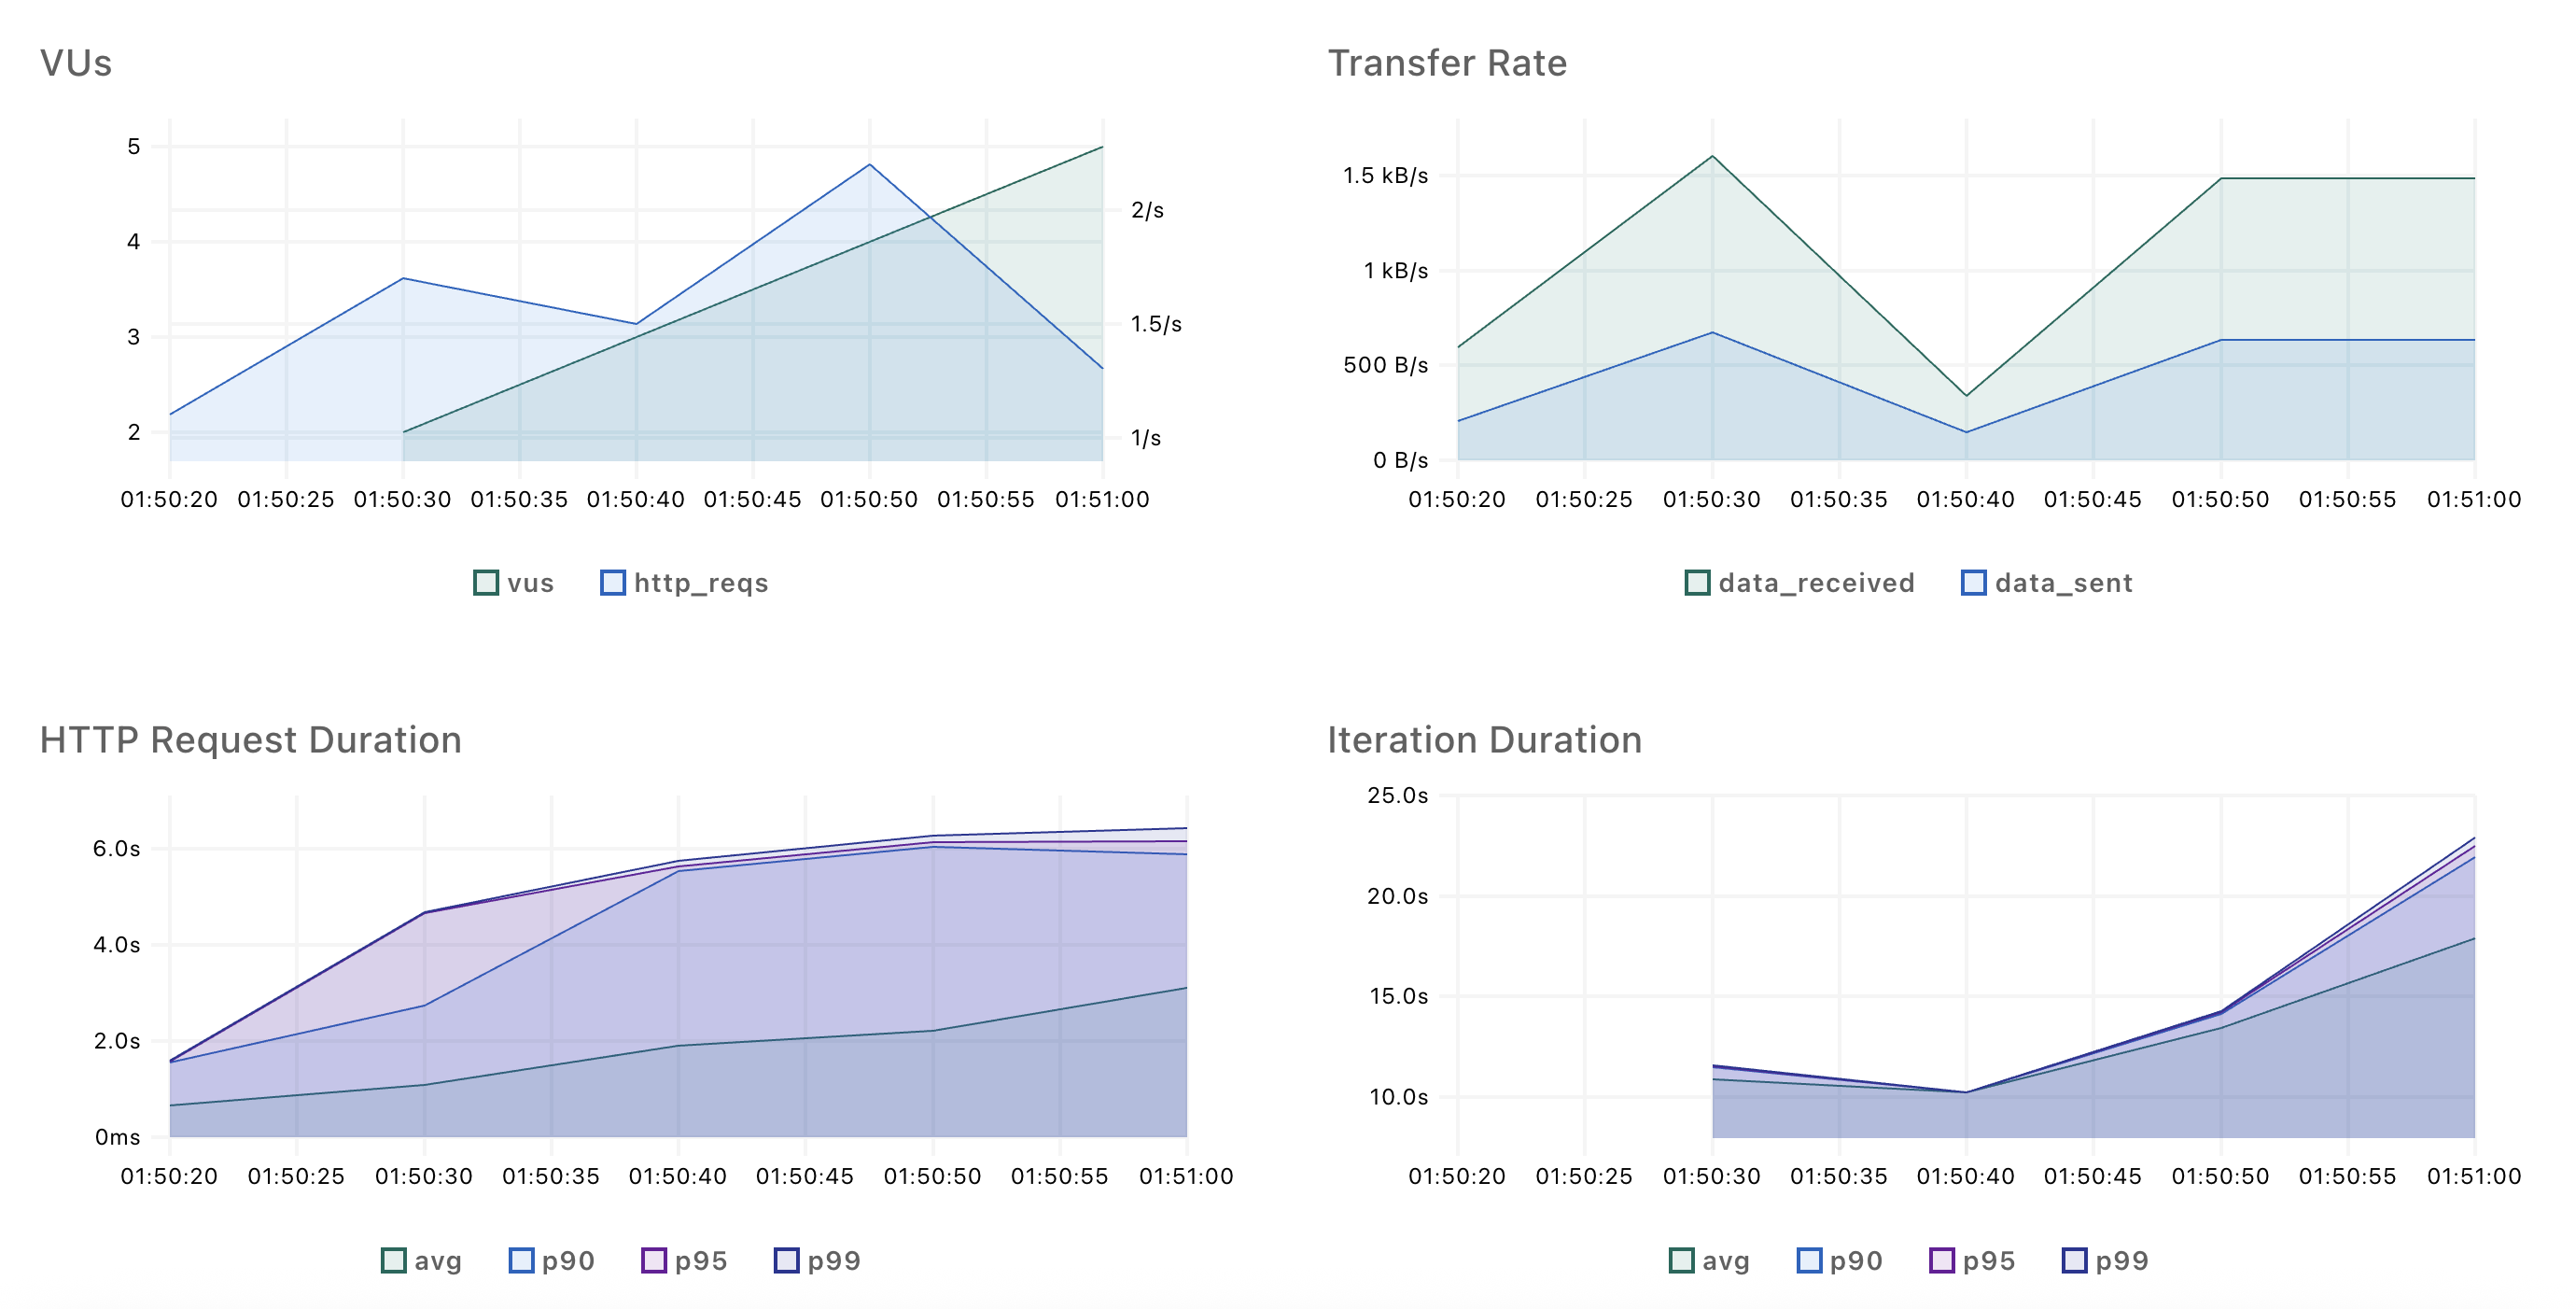
While the slack summary was great, there needed to be some way to visualize the metrics. Grafana Cloud offers a k6 integration for visualizing the test results in dashboard. However, we self-host most of our monitoring services and I wanted to keep it that way for a while atleast. Besides, a full-fledged dashboard would have been an overkill considering we didn’t really have a lot of load tests written in the first place :P.
A simpler alternative is the xk6-dashboard plugin, which can export a single HTML file with all the metrics collected in the test run. The output looks like this, which was good enough for me -
Now that the HTML file was generated, it needed to be accessible by other members of the team. For this I configured the Github Action to upload the HTML file to an S3 bucket, which was served by a Lambda function sitting behind an internal Application Load Balancer. The internal ALB could be accessed from our Twingate setup. The file was uploaded with the key <commit sha>/index.html to enable routing of different runs. The workflow file looked something like this -
    # Other steps
    - name: Run k6 test
        id: run-k6-test
        env:
          # Environment variables
        run: k6 run --out 'dashboard=port=-1&export=index.html' k6/home.js

    - name: Create dir for k6 dashboard
      run: |
        mkdir -p ${{ github.sha }}
        mv index.html ${{ github.sha }}/index.html

    - name: Upload xk6-dashboard to S3
      uses: parth-paradkar/upload-s3-without-acl@master
      with:
        aws_bucket: <bucket name>
        source_dir: ${{ github.sha }}
        destination_dir: ${{ github.sha }}

    - name: Post newly generated link to Slack
      uses: slackapi/slack-github-action@v2.1.1
      # Hard code the ALB base URL in the step's config (not given here) and append the newly generated file path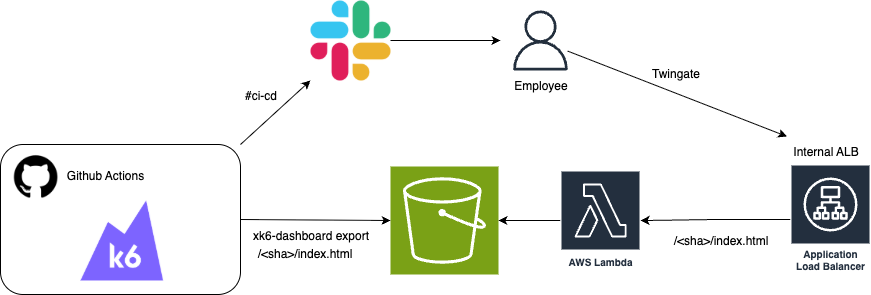
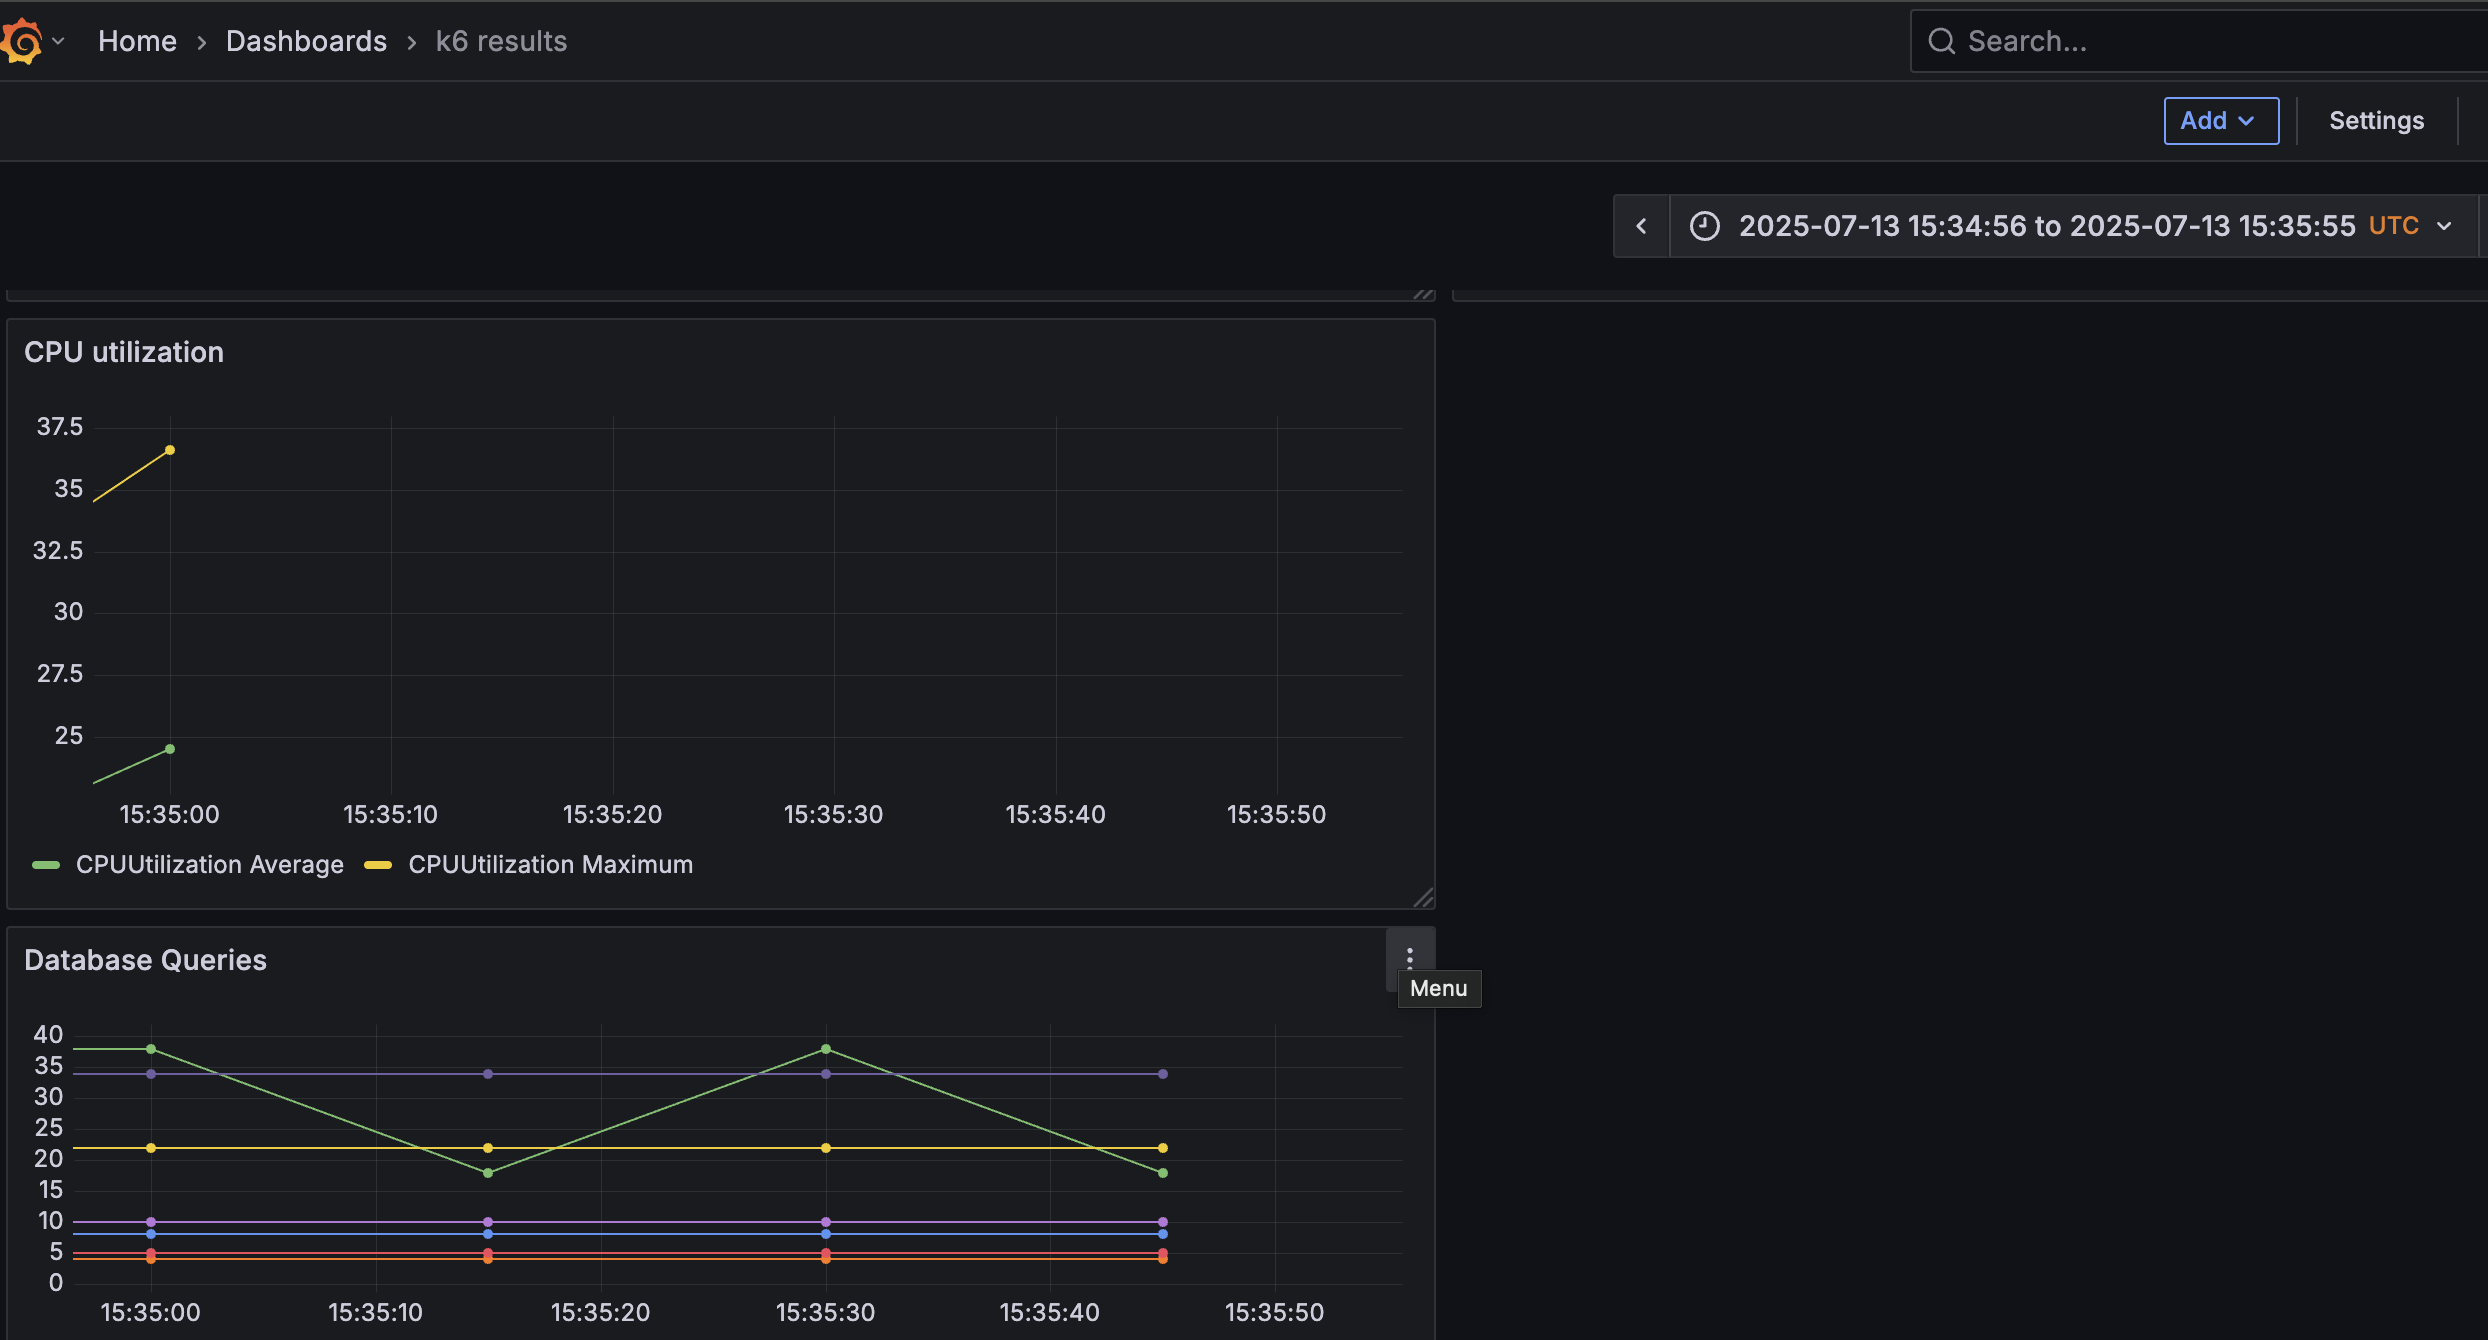
Infra metrics in Grafana
I also wanted to look at Prometheus and ECS metrics like database queries, CPU utilization and Memory Utilization during the load test. All that data was accessed through a dashboard in our self-hosted Grafana instance. An easy hack to look at these metrics in the context of the current run was to record the start and end time and use it in the URL params of the Grafana dashboard.
    # Other steps
    - name: Record start time
      id: record-start-time
      run: |
        start_time=$(date -u +'%Y-%m-%dT%H:%M:%S.%3NZ')
        echo "start_time=${start_time}" >> $GITHUB_OUTPUT

    # Steps mentioned previously

    - name: Record end time
      id: record-end-time
      run: |
        end_time=$(date -u +'%Y-%m-%dT%H:%M:%S.%3NZ')
        echo "end_time=${end_time}" >> $GITHUB_OUTPUT

    - name: Get Grafana dashboard link from start time and end time
      id: grafana_link
      if: always()
      run: |
        echo "grafana_link=https://<grafana host>/d/<dashboard name>?orgId=1&from=${{ steps.record-start-time.outputs.start_time }}&to=${{ steps.record-end-time.outputs.end_time }}&timezone=utc" >> $GITHUB_OUTPUT
So the URL looked something like this- https://<grafana host>/d/<dashboard name>?orgId=1&from=2025-07-13T15:34:56.568Z&to=2025-07-13T15:35:55.642Z&timezone=utc
This filters the dashboard to show the values for that timeframe (I should probably include the preceding and following minute for reference).